# Inside the ACP Console: My Own Agents, Real Data, Every Screen
The hardest thing to convey about a control plane is what you actually see once agents run through it. So here's my own workspace — the agents behind Calafia, running for real — walked screen by screen. Every number is real.
The hardest thing to explain about a control plane is what you actually *see* once your agents run through it. A feature list doesn't land it. So instead of describing the console, I'm going to show you mine — my real workspace, the agents behind [Calafia](https://calafia.ai), running in production. Every number below is real, pulled straight from the dashboard. Nothing staged.
Four screens: see every action, control every action, price every action.
{% include demo-video.html
src="acp-yt-console-tour-yt"
gif="false"
name="A tour of the ACP console: activity, approvals, runs and the cost X-ray"
description="Unedited screen recording of the live console: the activity feed with one row per governed tool call, the approvals queue a step-up policy feeds, runs sorted by cost, and a run's Cost X-ray showing the orchestration loop at 96% of the bill in this run."
duration="PT1M17S"
upload_date="2026-08-21"
alt="Screen recording of the ACP console: the activity feed shows one row per governed tool call with its tool, risk level, reason, identity and latency; the approvals queue shows what a step-up policy sends for human review; the runs list is sorted by cost; and a run's Cost X-ray breaks the bill into the orchestration loop versus leaf model work, with every tool call free."
caption="The four screens below, moving. Operator email and API key identity are masked; nothing else is altered."
transcript="The install videos end at one audit file, on one machine. This is the other half. Connect a workspace and every governed call lands in one feed. One row per call: the tool, what it's allowed to do, the risk, and why. Identity and latency on every row — and for model calls, the tokens and the cost. Approvals is where a step-up policy sends blocked actions. Nothing here has executed. Right now, nothing waiting. 31 approved, 1 rejected. Back to the feed. This is every agent in the workspace, not one terminal. Runs is one row per execution. Sort by cost and the expensive ones surface. Open the top run and the money view breaks it apart. The orchestration loop is 96% of the bill. Every Edit, Bash and Read call: free. Real workspace, real traffic. Connect one and it starts filling in." %}
---
## 1. Every agent, every call — one view
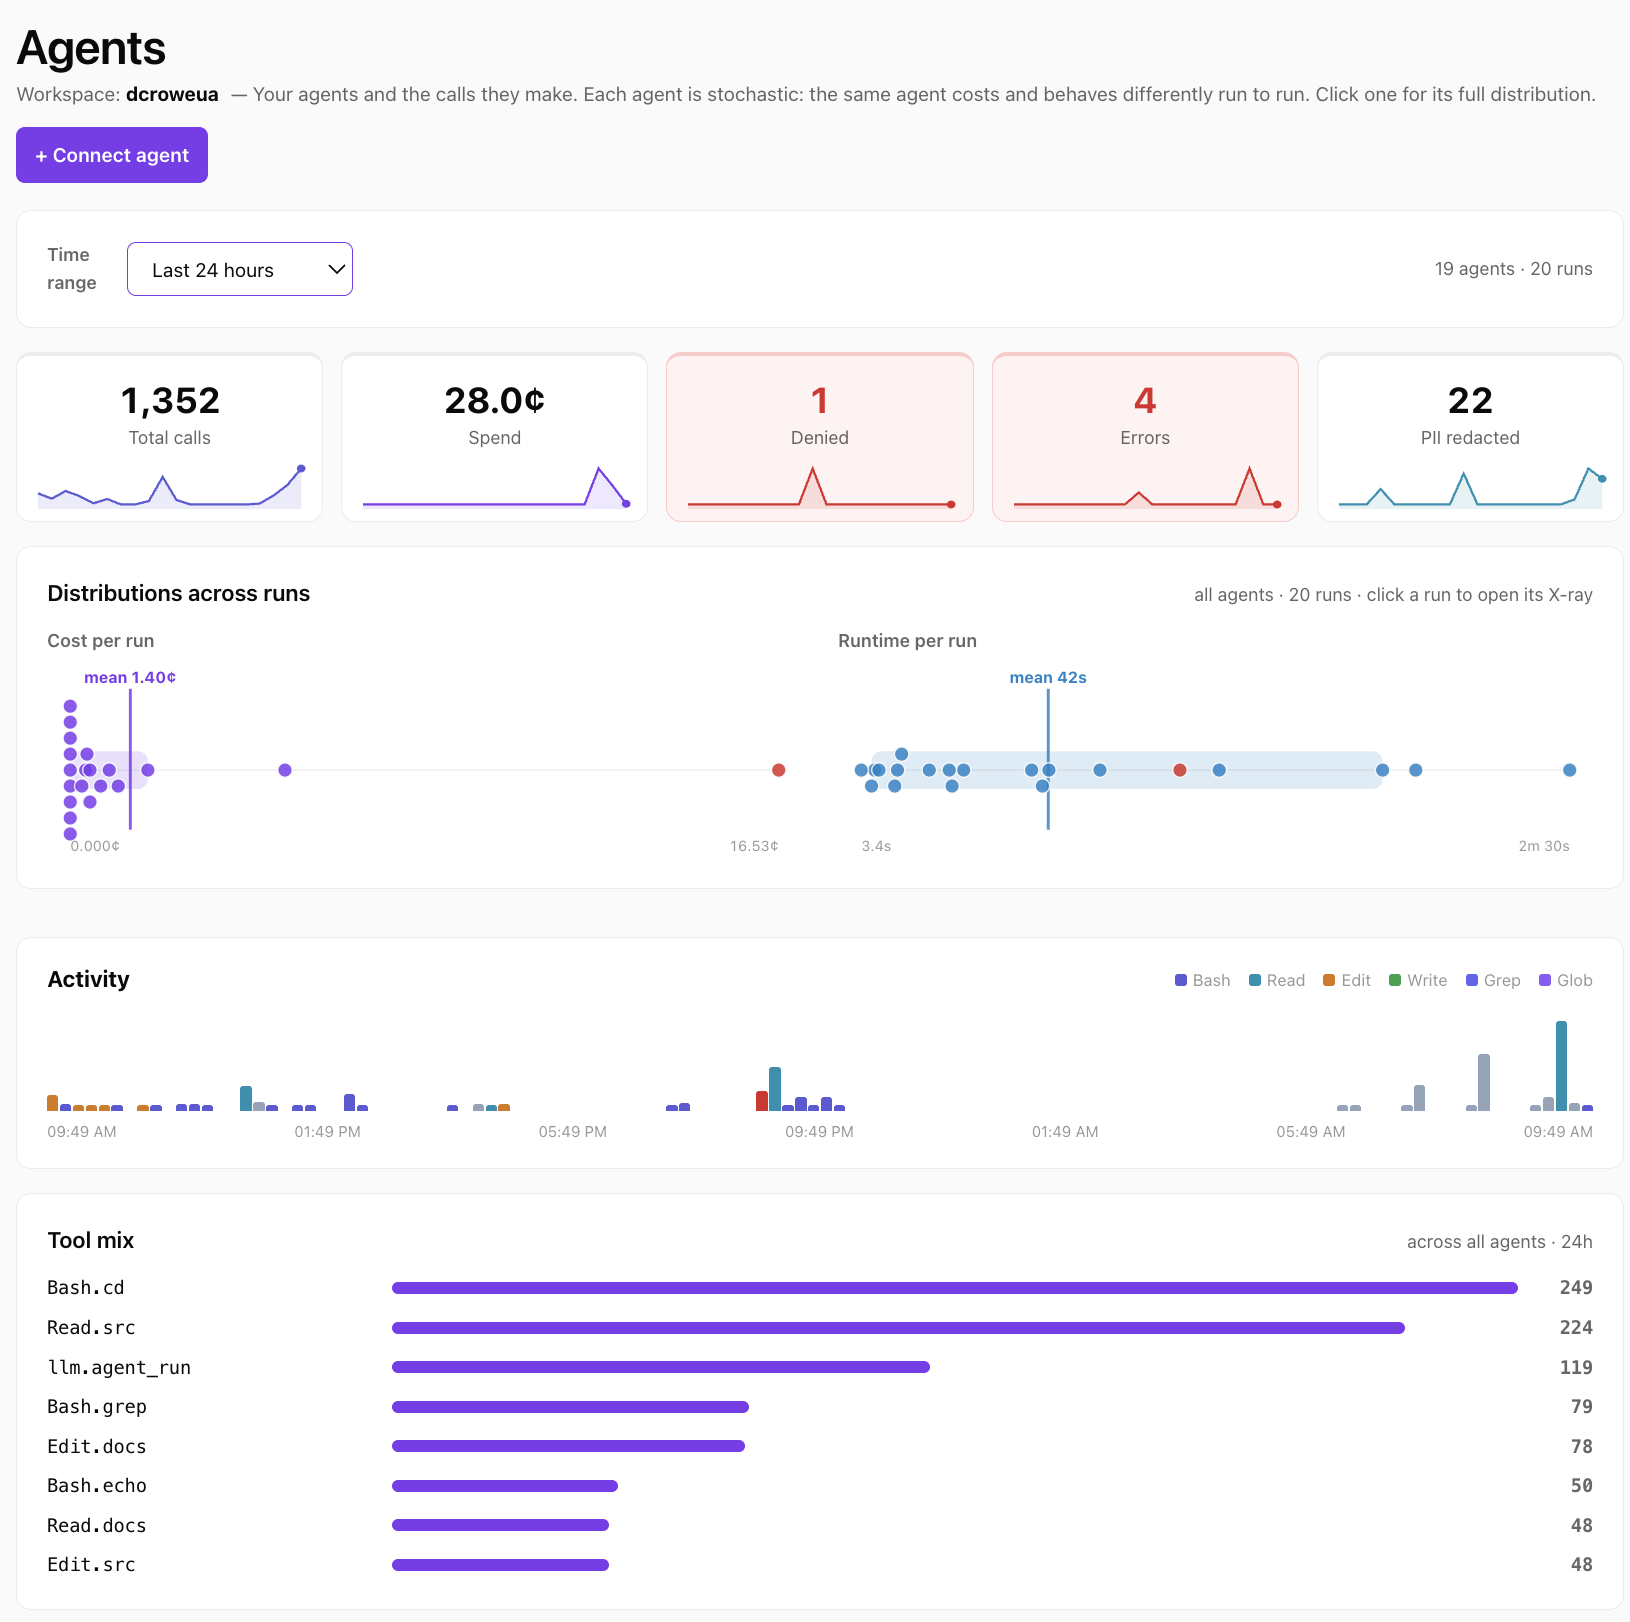 This is the first thing I open. In the last 7 days: **19,662 governed tool calls** across 28 agents, **$784.63** of model spend, **140 calls denied**, **165 errors**, **121 PII redactions** — each with a little trend line. Below that, the run distributions: every run as one dot, cost-per-run and runtime-per-run, with the long-tail outliers pulled into a gutter so the typical range stays readable.
That's the black box, turned into a dashboard. Before ACP, "what did all my agents do today, and what did it cost" was a question I couldn't answer without grepping logs across services. Now it's the landing page. The denied and PII-redacted counters are control *working* — quietly — and the distribution plot at the top (one dot per run) is the tell that agents don't behave like normal software.
## 2. The same agent is never the same twice
This is the first thing I open. In the last 7 days: **19,662 governed tool calls** across 28 agents, **$784.63** of model spend, **140 calls denied**, **165 errors**, **121 PII redactions** — each with a little trend line. Below that, the run distributions: every run as one dot, cost-per-run and runtime-per-run, with the long-tail outliers pulled into a gutter so the typical range stays readable.
That's the black box, turned into a dashboard. Before ACP, "what did all my agents do today, and what did it cost" was a question I couldn't answer without grepping logs across services. Now it's the landing page. The denied and PII-redacted counters are control *working* — quietly — and the distribution plot at the top (one dot per run) is the tell that agents don't behave like normal software.
## 2. The same agent is never the same twice
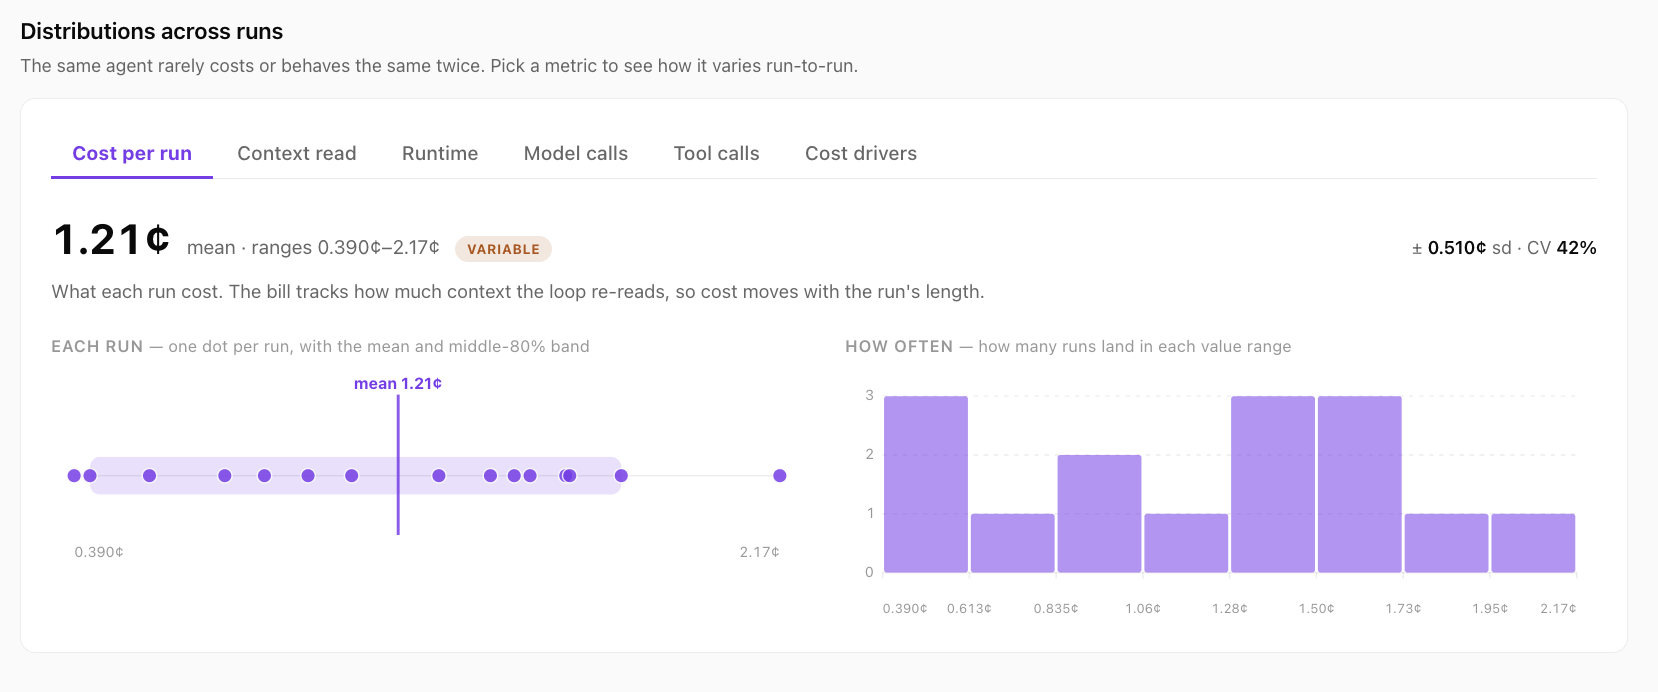 Click any agent and you get its distribution across runs. This is Claude Code over a week: a **median run costs $18.59 — but runs range from under 1¢ to $501.61**, a coefficient of variation of 172%, flagged *erratic*. Same agent, wildly different cost run to run, because each run does different work and the loop re-reads a different amount of context each time.
This is the thing traditional observability misses: an agent isn't a function with a fixed cost, it's a distribution. If you're watching the average, you're blind to the tail — the $501 run hiding behind an $18 median, or the one that quietly stalls. ACP shows the whole spread — cost, runtime, model calls, tool calls — per agent.
## 3. Where the money actually goes
*Update, September 2026: the console now opens cost on its own page.*
Click any agent and you get its distribution across runs. This is Claude Code over a week: a **median run costs $18.59 — but runs range from under 1¢ to $501.61**, a coefficient of variation of 172%, flagged *erratic*. Same agent, wildly different cost run to run, because each run does different work and the loop re-reads a different amount of context each time.
This is the thing traditional observability misses: an agent isn't a function with a fixed cost, it's a distribution. If you're watching the average, you're blind to the tail — the $501 run hiding behind an $18 median, or the one that quietly stalls. ACP shows the whole spread — cost, runtime, model calls, tool calls — per agent.
## 3. Where the money actually goes
*Update, September 2026: the console now opens cost on its own page.*
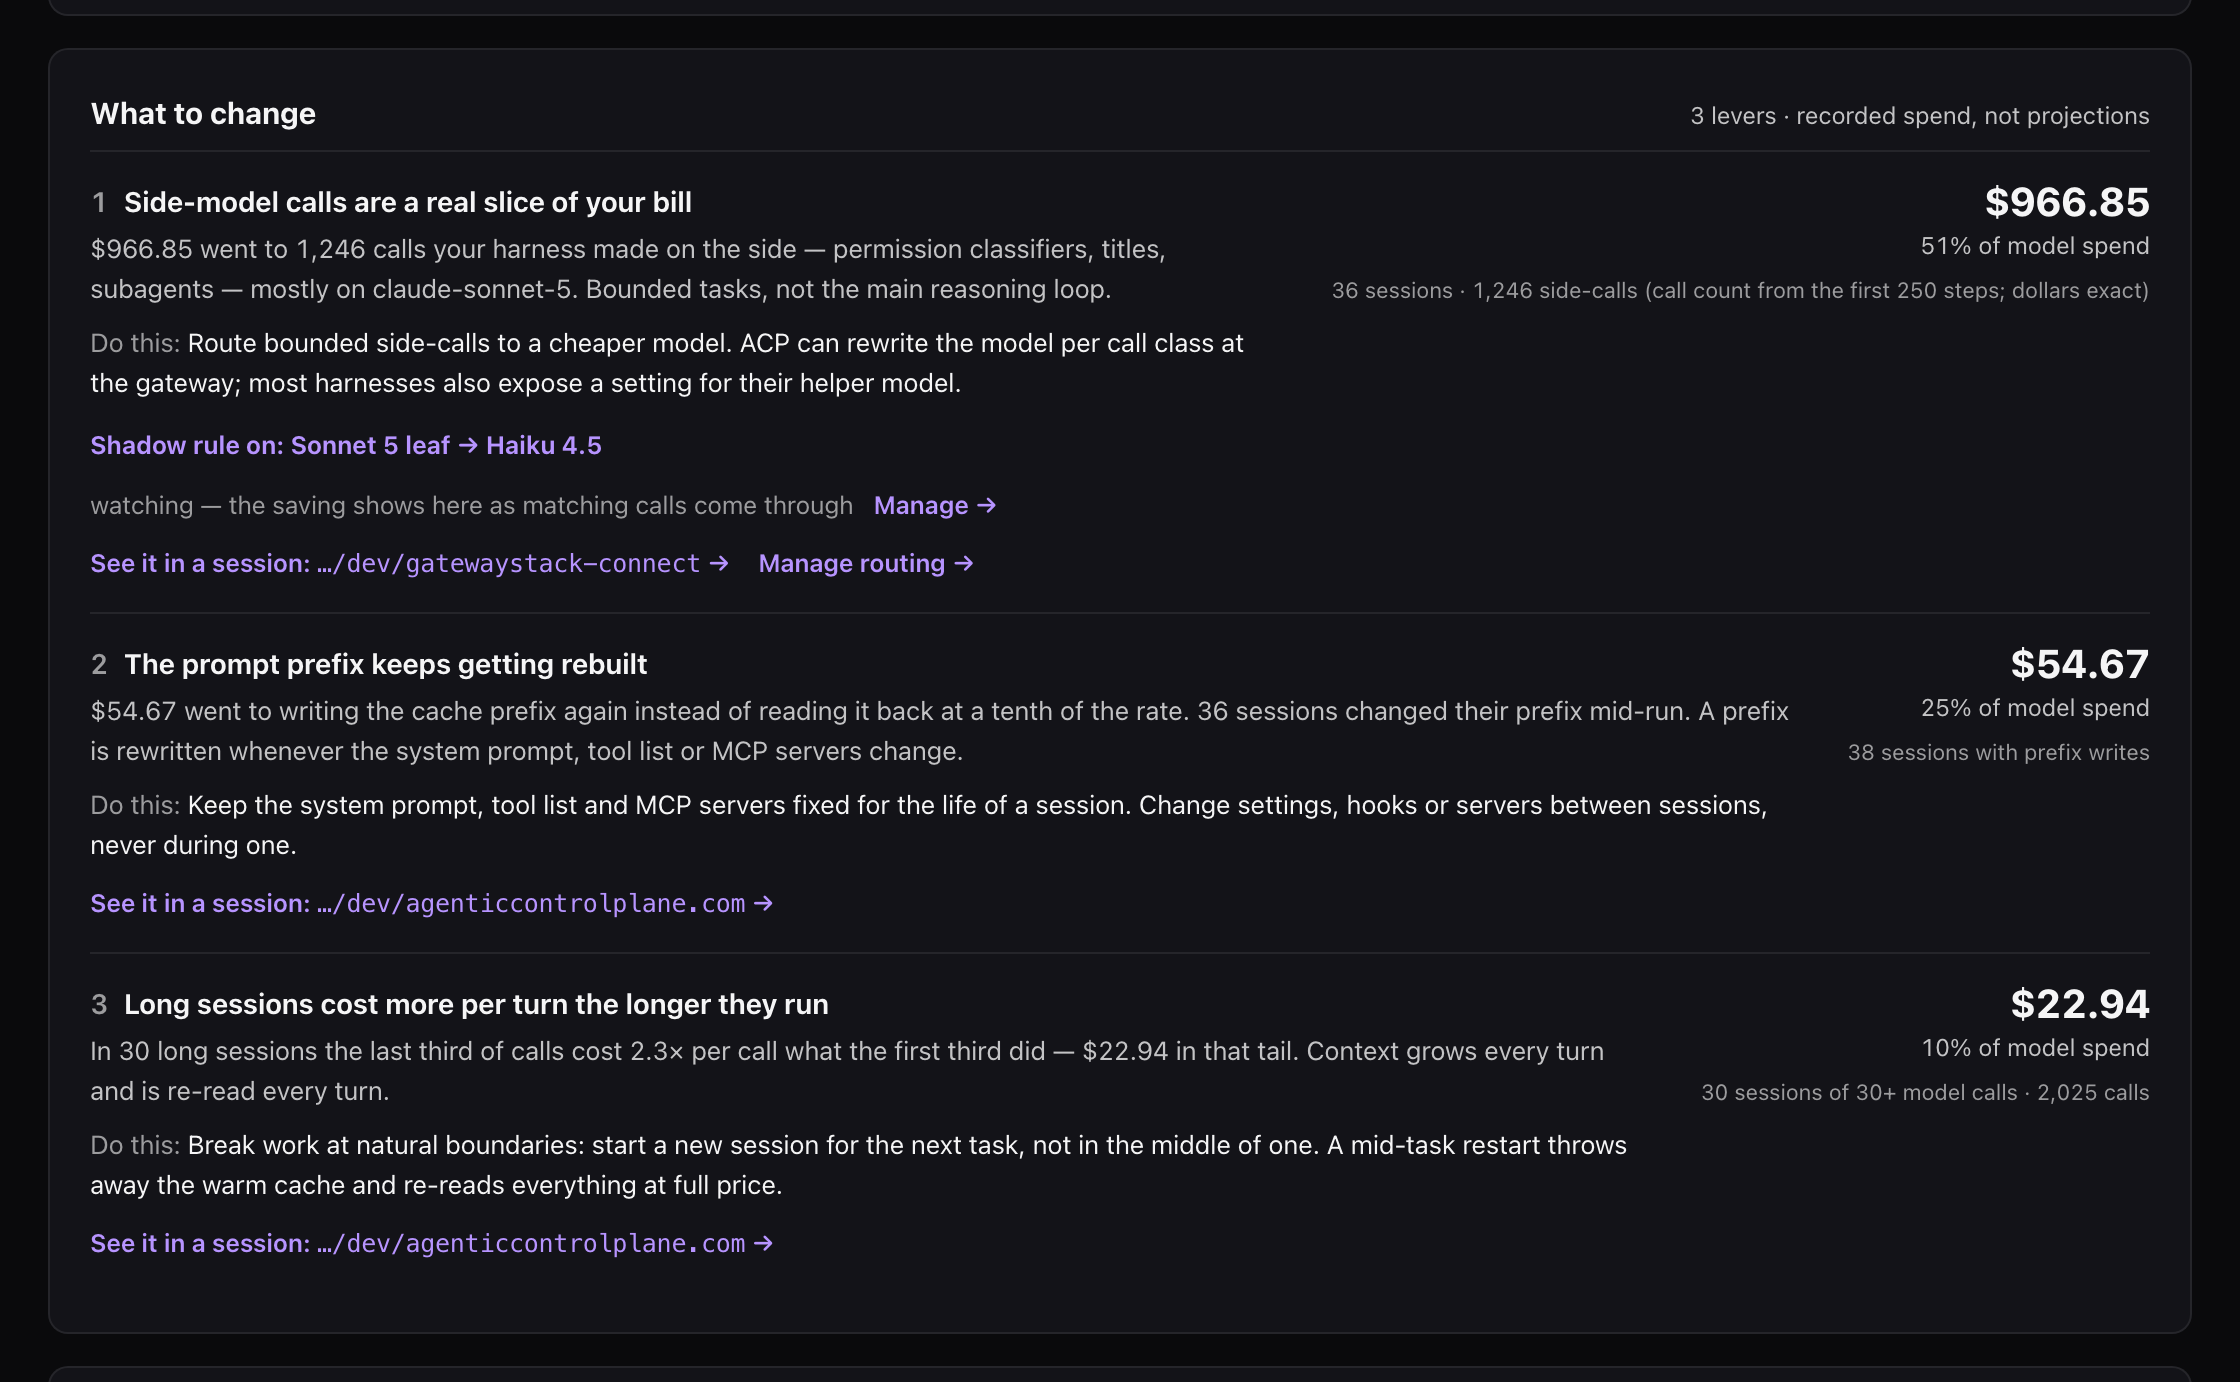
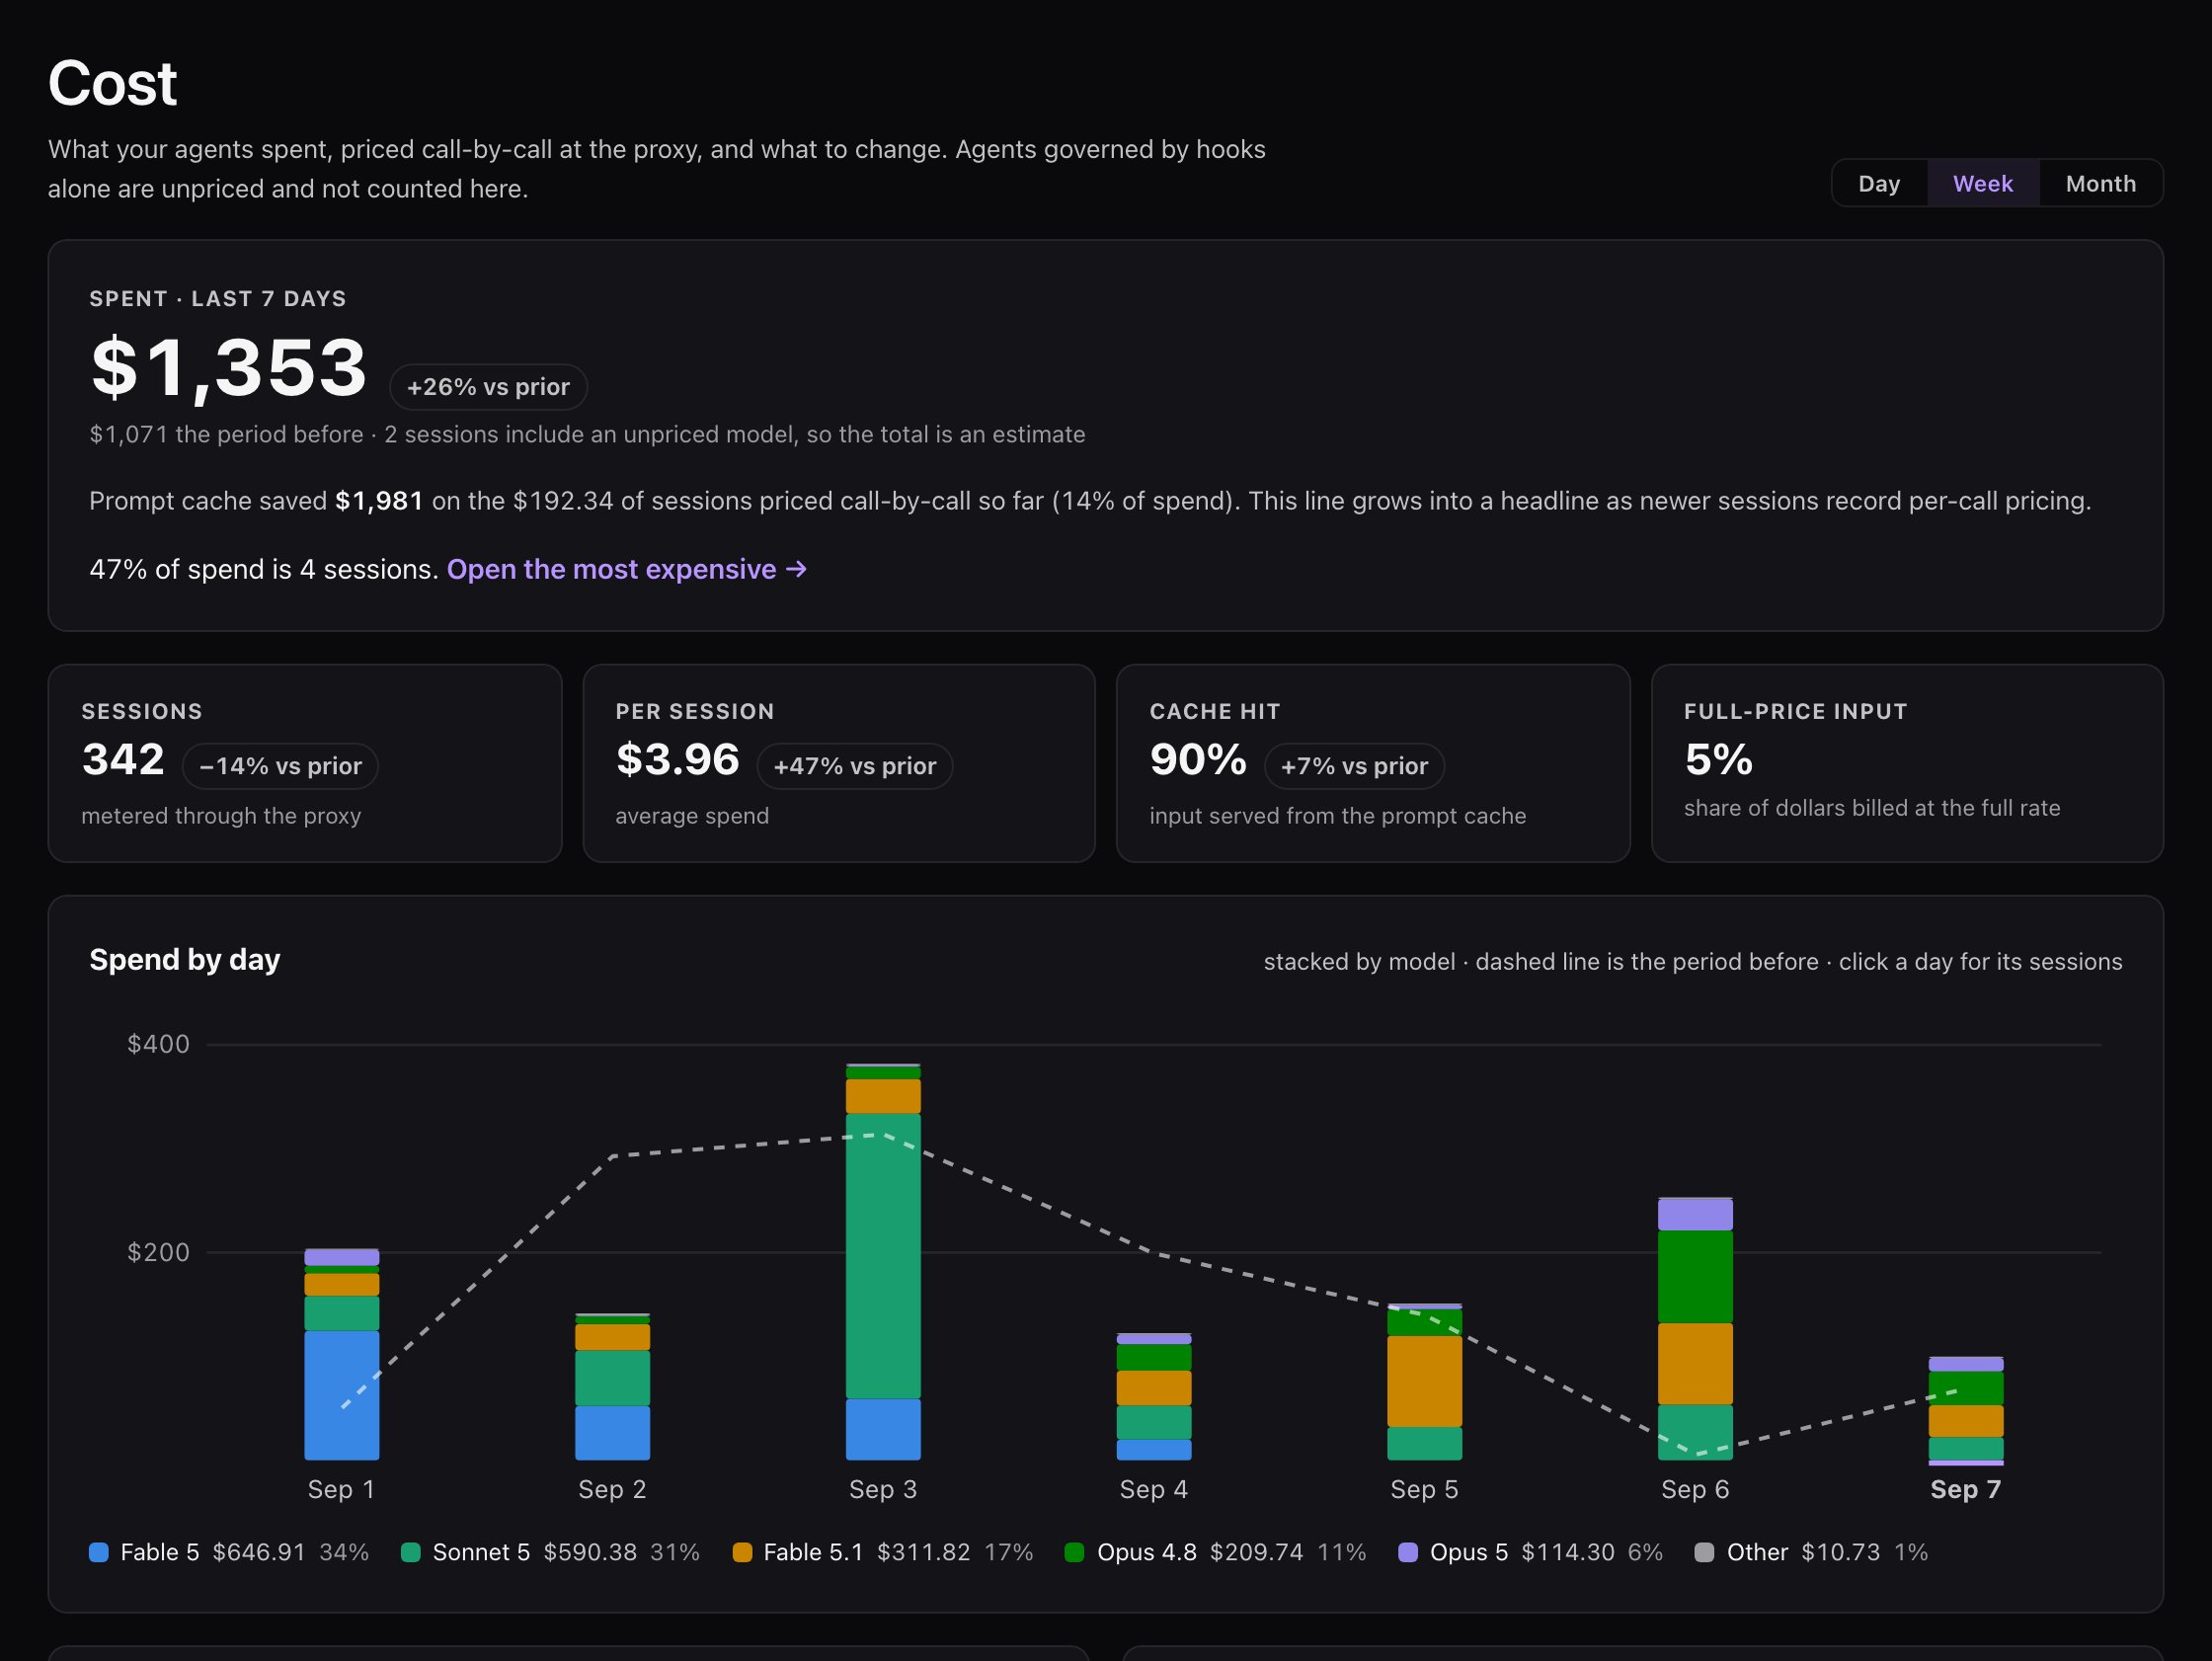 The Cost page answers the four questions in order: how much, on what, is it going up, and what to change. The last one is a list of levers measured from your own calls — side-model calls your harness makes on its own, the prompt prefix being rebuilt, long sessions whose last third costs more per turn, recovery turns after failed or denied calls — each with the recorded dollars, one concrete change, and a session that shows it:
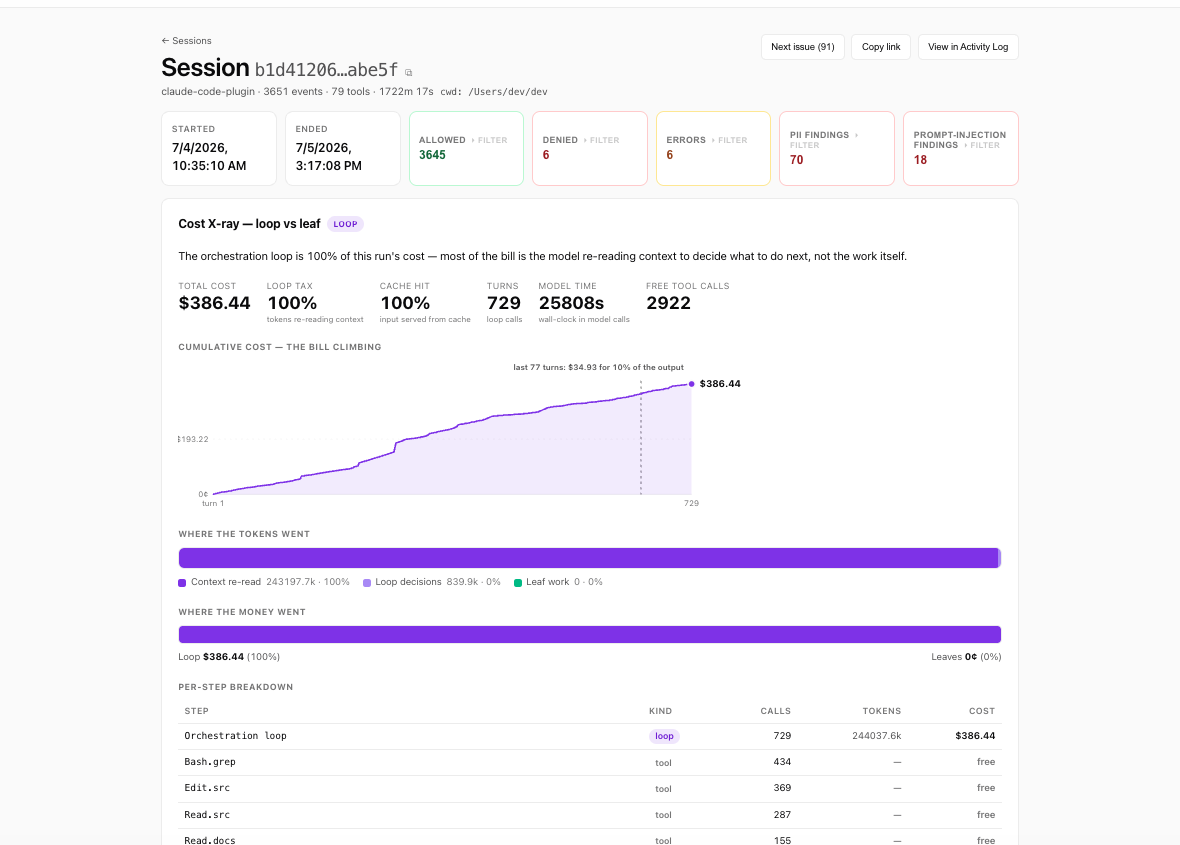
 This is the screen I built ACP for. Open a single run and it decomposes the bill **loop vs. leaf**.
This run cost 0.390¢, and **99% of it was the orchestration loop** — the model re-reading its own growing transcript to decide what to do next — **not the actual work**. The leaf tools (web search, memory lookup, sending an email) were *free*. The per-step table names the culprit; "context growth" charts the transcript ballooning to 59.3k tokens by the end; and **What to optimize** spells out the move: prune context between turns, use fewer and better-specced tools so the loop takes fewer turns.
I call this the loop tax, and almost nobody measures it, because measuring it requires being *both* in the call path *and* pricing every call in dollars. Observability tools watch but don't price the enforcement point; gateways price tokens but don't decompose the run. ACP is one layer, so the governed call and the metered call are the same event — which is the only way you get this view.
## 4. And the control
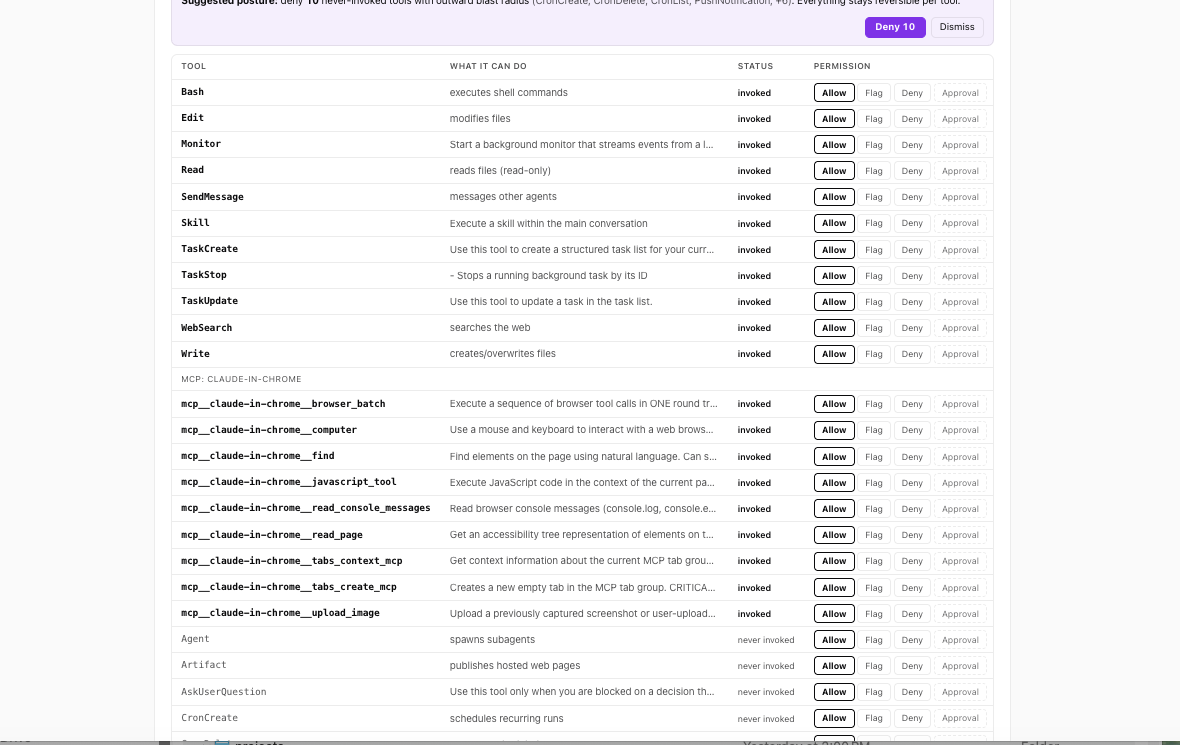
Seeing is half of it. Here's the other half — per agent, every declared tool — captured from the agent's own requests before anything runs — is a row with **allow, flag, or deny** one click away, enforced at the call itself, *outside the model*. This one runs in the background tier. I can deny `notifications.sendEmail` or any destructive tool and it's blocked no matter what the model decides to do — a poisoned web page can't talk it into an exception, because the rule doesn't live in the prompt.
Every workspace starts in **audit mode**: watch everything, block nothing. When you've seen enough, you flip to enforce. No big-bang policy migration, no rewriting your agents.
## None of this is trapped in the UI
One thing that matters more than any single screen: **the console isn't the only way to get at this data.** The activity log, the agent rollups, the policy decisions — it's all queryable and exportable as CSV, not locked inside the UI. Per-step cost decomposition like the X-ray above is console-side today; the audit and activity data is what's available through the API. ([API docs →](/docs/api/))
Pipe the export into your warehouse, a Grafana board, a weekly cost digest in Slack — whatever you want. A control plane that locks your own agents' data inside its UI isn't a control plane, it's a roach motel. Yours comes with you.
---
## That's the whole thing, in four screens
See every action, control every action, price every action — for whatever agents you're already running, across whatever framework. It's the same console you just looked at; the only difference is the data would be yours.
It's free on your own agents — up to 5 initiating agents, unlimited calls, no card:
```bash
curl -sf https://agenticcontrolplane.com/install.sh | bash
```
One command, about 30 seconds to your first governed call. Or if you'd rather not do it alone, [book 30 minutes](/call) and I'll wire it into your agent with you, live. Poke around, break it, tell me what's missing.
*— David*
[Start free →](https://cloud.agenticcontrolplane.com/login) · [Pricing →](/pricing) · [How the loop tax works →](/blog/the-loop-tax)
This is the screen I built ACP for. Open a single run and it decomposes the bill **loop vs. leaf**.
This run cost 0.390¢, and **99% of it was the orchestration loop** — the model re-reading its own growing transcript to decide what to do next — **not the actual work**. The leaf tools (web search, memory lookup, sending an email) were *free*. The per-step table names the culprit; "context growth" charts the transcript ballooning to 59.3k tokens by the end; and **What to optimize** spells out the move: prune context between turns, use fewer and better-specced tools so the loop takes fewer turns.
I call this the loop tax, and almost nobody measures it, because measuring it requires being *both* in the call path *and* pricing every call in dollars. Observability tools watch but don't price the enforcement point; gateways price tokens but don't decompose the run. ACP is one layer, so the governed call and the metered call are the same event — which is the only way you get this view.
## 4. And the control
Seeing is half of it. Here's the other half — per agent, every declared tool — captured from the agent's own requests before anything runs — is a row with **allow, flag, or deny** one click away, enforced at the call itself, *outside the model*. This one runs in the background tier. I can deny `notifications.sendEmail` or any destructive tool and it's blocked no matter what the model decides to do — a poisoned web page can't talk it into an exception, because the rule doesn't live in the prompt.
Every workspace starts in **audit mode**: watch everything, block nothing. When you've seen enough, you flip to enforce. No big-bang policy migration, no rewriting your agents.
## None of this is trapped in the UI
One thing that matters more than any single screen: **the console isn't the only way to get at this data.** The activity log, the agent rollups, the policy decisions — it's all queryable and exportable as CSV, not locked inside the UI. Per-step cost decomposition like the X-ray above is console-side today; the audit and activity data is what's available through the API. ([API docs →](/docs/api/))
Pipe the export into your warehouse, a Grafana board, a weekly cost digest in Slack — whatever you want. A control plane that locks your own agents' data inside its UI isn't a control plane, it's a roach motel. Yours comes with you.
---
## That's the whole thing, in four screens
See every action, control every action, price every action — for whatever agents you're already running, across whatever framework. It's the same console you just looked at; the only difference is the data would be yours.
It's free on your own agents — up to 5 initiating agents, unlimited calls, no card:
```bash
curl -sf https://agenticcontrolplane.com/install.sh | bash
```
One command, about 30 seconds to your first governed call. Or if you'd rather not do it alone, [book 30 minutes](/call) and I'll wire it into your agent with you, live. Poke around, break it, tell me what's missing.
*— David*
[Start free →](https://cloud.agenticcontrolplane.com/login) · [Pricing →](/pricing) · [How the loop tax works →](/blog/the-loop-tax)