# One Sentence in Our System Prompt Doubled the Agent's Bill
A live spend counter we injected to keep agents on budget was silently disabling prompt caching — and more than doubling the cost of exactly the agents it was meant to protect. Metered before/after inside.
Here's a bug that hid in plain sight for months, cost us real money, and taught us something every builder running agents at scale should check today: **a single dynamic sentence at the top of a system prompt can silently turn off prompt caching for the entire run.**
We found it while benchmarking context strategies. One arm — the one that keeps the full conversation history every round and *should* be the most cache-friendly thing possible — showed a **2% cache-hit rate.** That's not low. That's broken. An append-only transcript is the textbook case for prompt caching: the prefix never changes, so every round after the first should read almost entirely from cache at roughly a tenth of the price.
So we did the thing you can only do when every model call is metered: we opened the session's cost X-ray, saw the cache-hit number pinned near zero where it should have been near 100%, and pulled two consecutive requests from the trace to compare byte for byte.
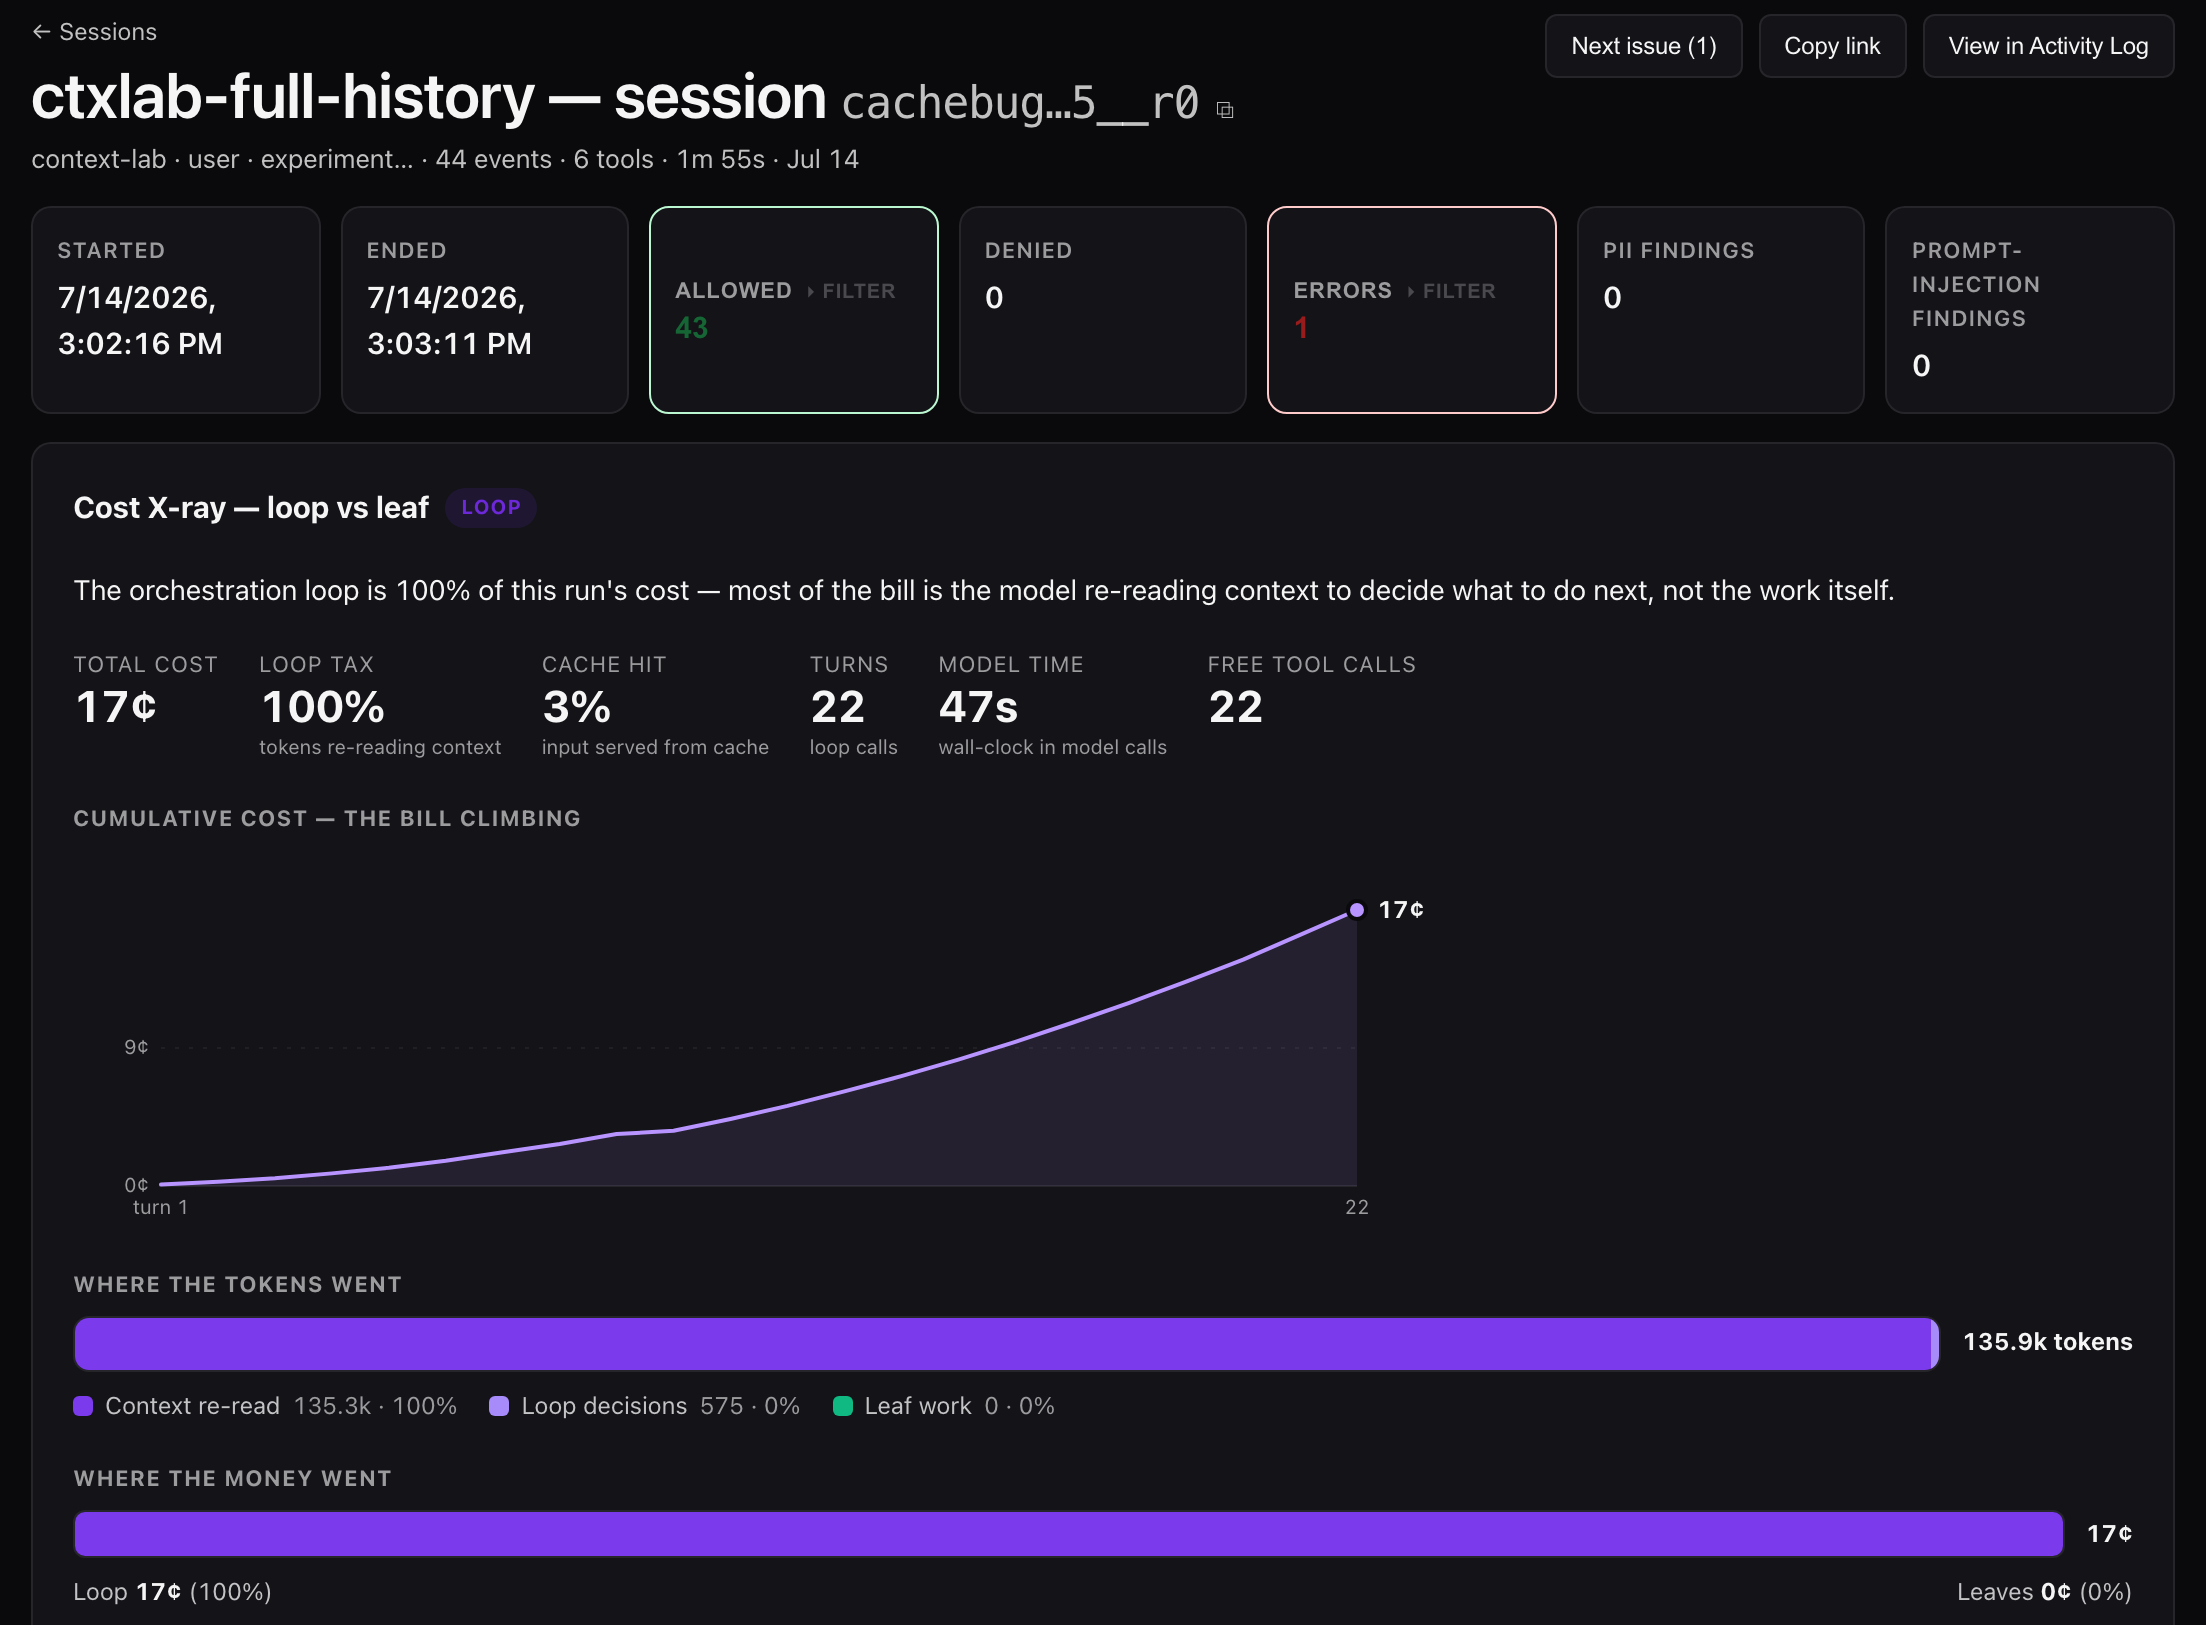
The view that caught it. Full-history arm on Gemini 2.5 Pro — an append-only transcript that should serve nearly all of its input from cache is at 3%, and the cumulative-cost curve bends upward because every turn re-buys the entire context. (The original batch predates our session view; this is the same broken config re-run with tracing on.)
## The culprit was a guardrail
The requests were nearly identical — same tools, same history, same task. The difference was in the **first few lines of the system prompt**:
```
--- Budget context ---
You've spent $0.34 of a $2.00 hard limit on this run. $1.66 remains.
```
We inject that line every round so the agent stays aware of its budget and wraps up before blowing the cap. It's a sensible guardrail. It's also **poison for the cache**, because prompt caching matches on an *exact, byte-stable prefix* — and the system prompt leads the request. Every round, that dollar figure ticks up, the first bytes change, and the cache is invalidated for *everything downstream*: the whole system prompt, every tool definition, the entire transcript. One moving number at the top throws away the cache for the entire run.
## The measured cost
We reran the same arm with one change — freeze the budget text so it's byte-stable (same enforcement, no live figure):
| System prompt | Cache hit | Cost per run |
|---|---|---|
| Dynamic (live spend line) | **2%** | 41.5¢ |
| Static (byte-stable) | **57%** | 18.7¢ |
Same model, same task, same context. **More than half the cost, gone**, by moving one sentence out of the changing region.
One variable changed between conditions: whether the budget line's dollar figure updates each round. Gemini 2.5 Pro, identical task and context strategy, every call metered at the gateway. Frozen-arm rows aren't in the published dataset; the live-arm 2% reproduces from ctxlab-w1-rows.json.
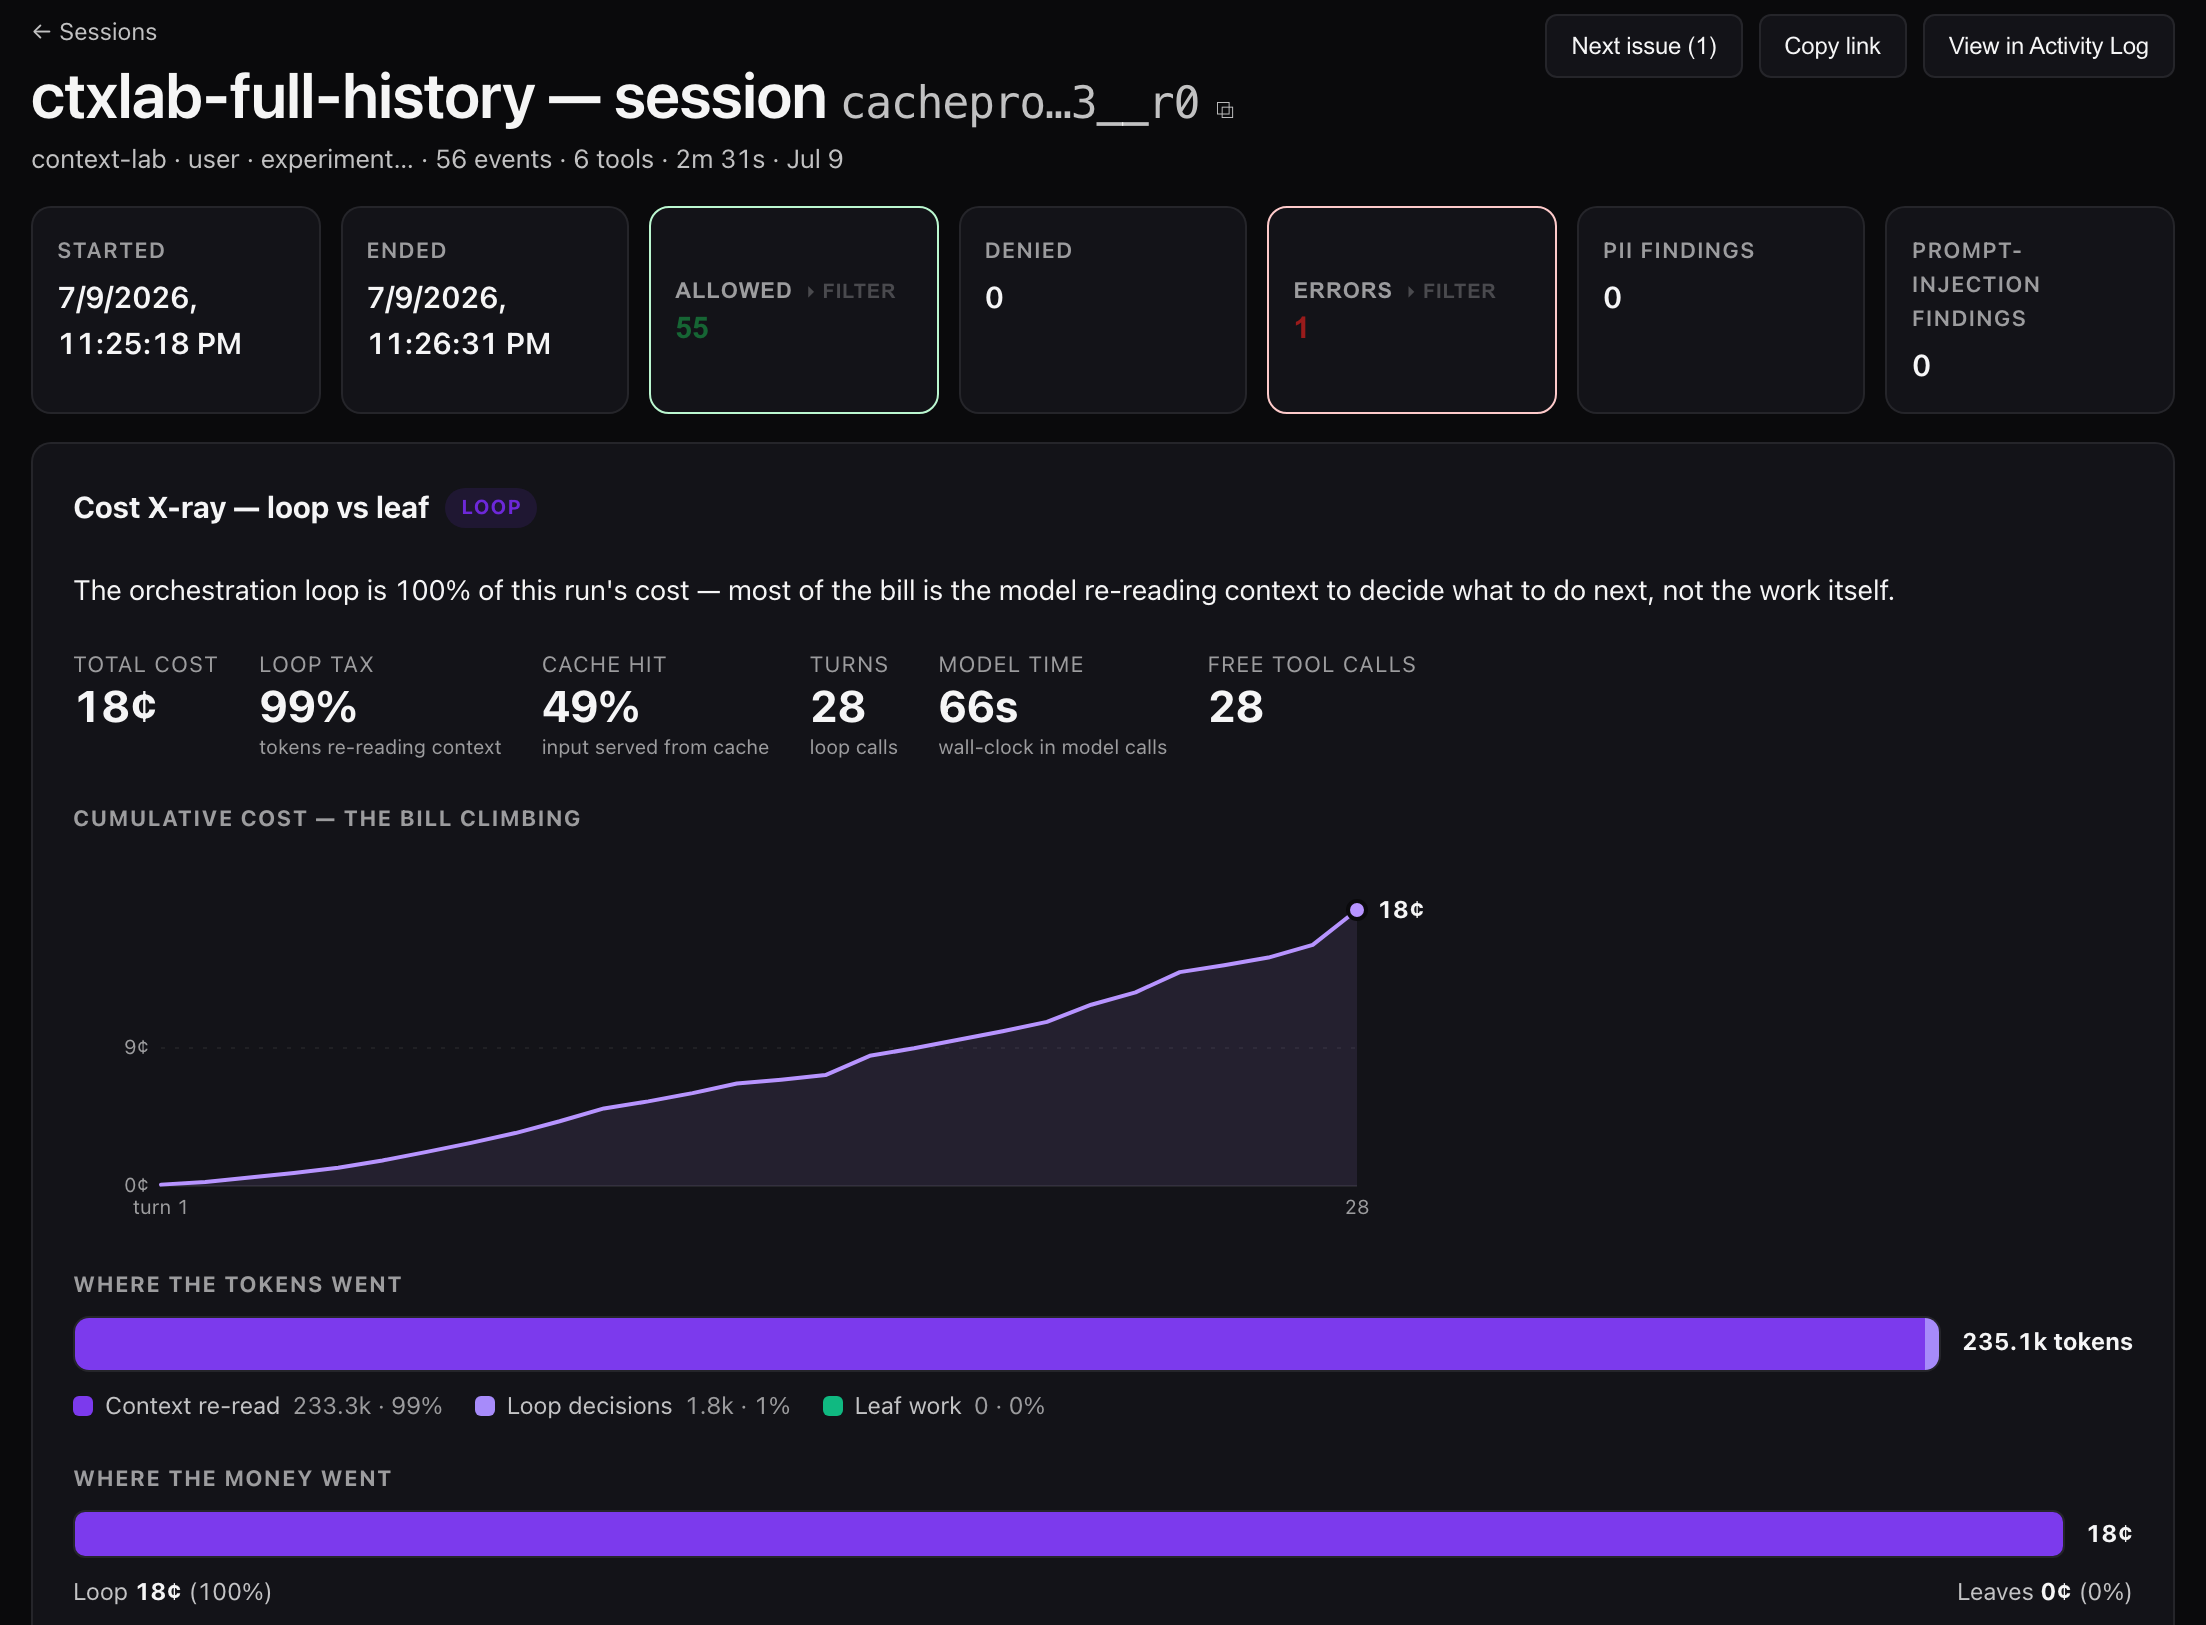
Here's what the fix looks like in the same view:
Same agent, byte-stable prompt. This run re-read 73% more context than the broken one above — 235k tokens vs 136k — for the same money, because half the input is served from cache instead of bought fresh. These are single runs; the table's 2% / 57% are batch means.
## The twist that makes it worse than it looks
We almost dismissed this as small, because on our *cheap* Gemini Flash runs the same dynamic line still cached fine — 78% hit. That doesn't contradict the finding; it sharpens it. The spend figure only busts the cache when it *changes* between rounds. On Flash, runs are so cheap the two-decimal dollar figure barely moves (`$0.00`, `$0.00`, `$0.01`…), so the prefix stays stable by accident. On Pro, cost accrues fast enough that the number changes every round, so the cache breaks every round.
That's the dangerous part: **the bug does the most damage to your most expensive agents.** The exact runs where you care most about cost are the ones where a "helpful" live counter is quietly doubling the bill. A cheap prototype looks fine; the same code in production on a capable model bleeds.
## The general rule: watch what changes at the top of your prompt
The budget line is one instance of a whole class. Anything you inject into the *stable region* of a request — system prompt or the leading messages — that changes between turns will silently defeat caching for the rest of the request. Common offenders:
- **Timestamps or "current time" at the top of the system prompt.** Moves every call.
- **Injected memory / RAG context prepended to the system prompt.** Different every turn.
- **A tool list that grows or reorders** (adding an MCP server mid-session, dynamic tool selection).
- **Live counters, run IDs, or per-turn metadata** in the leading bytes.
The fix is almost always the same: **push volatile content to the *end* of the message list, and keep the prefix — system prompt, tools, early history — byte-stable.** Your dynamic data still gets to the model; it just rides at the bottom where it doesn't invalidate everything above it. If you genuinely need the agent to see live spend, inject it only when it crosses a threshold (so the prefix busts twice a run, not every round), or put it in the latest user turn instead of the system prompt.
## How to check your own agents in five minutes
You can't fix this if you can't see it, and most agent stacks report a single blended token count that hides the cache split entirely. You need per-call cost broken into fresh input, **cached input**, and output. With that:
1. Find an agent whose context is append-only or slowly-growing — it *should* show a high cache-hit rate after the first couple of rounds.
2. If its cache-hit rate is near zero, diff two consecutive requests and look at the **first few hundred bytes**. Something in there is changing.
3. Whatever it is, move it out of the prefix.
We caught this because our gateway meters every call with the cache read/write split exposed — the same per-action cost accounting the [cost X-ray](/blog/inside-the-acp-console) is built on. If your observability stops at "tokens used," this failure is invisible: the bill goes up, the dashboard says everything's fine, and nobody diffs the prefix. That slow, silent regression — same agent, same traffic, rising bill — is [agent cost drift](/agent-cost-monitoring).
## Caveats, honestly
The numbers here are Gemini 2.5 with implicit caching; the exact hit rates and break-even points differ across providers and between implicit and explicit caching. But the mechanism — *a changing prefix invalidates the cached suffix* — is universal to how prompt caching works everywhere. The lesson isn't a Gemini number. It's: **treat the top of your prompt as sacred, and be suspicious of anything helpful you're tempted to inject there.**
---
*Part of [The Agent Optimization Manual](/agent-optimization-manual) — measured lessons on making agents cheaper and more reliable, every number metered at the gateway, not estimated.*
[What is an Agentic Control Plane? →](/what-is-an-agentic-control-plane) · [See the cost X-ray →](/blog/inside-the-acp-console)