The Gemini cache dead zone: why the newest Flash quietly stopped caching your agent's prompts

Run agents? ACP lets you see, control, and price every tool call they make — allow/ask/deny policy, per-session cost, and a full audit log for Claude Code, Cursor, Codex, and OpenClaw, in one command:
curl -sf https://agenticcontrolplane.com/install.sh | bashirm https://agenticcontrolplane.com/install.ps1 | iexGetting started → · see your first governed call → · free up to 5 agents
Our agent’s bill looked wrong.
It’s a small standing agent — polls a few sources, thinks, writes to a log. Cheap by design. But the input-token cost wasn’t falling the way it should have. Every turn re-sends the same system prompt, the same tool definitions, a growing scrap of history — a big, near-identical prefix. That’s the textbook case for implicit prompt caching, where the provider recognizes the repeated prefix, skips recomputing it, and passes you a 90% discount. Google’s docs say it’s automatic on Gemini 2.5 and newer. We should have been paying cache prices.
The ledger said we were paying full price. Zero cached tokens. Not “less than expected” — zero, run after run.
So we did the thing you can only do when you’re metering the actual request path: we made the cache tell us what it was doing.
What the meter found
We sent byte-identical prompts of increasing size through the model, four times each, and recorded the provider’s own reported cache reads on the warm repeats. If caching works, the second identical request should come back mostly cached. We swept prompt sizes from 1.5K to 24K tokens, then ran the whole thing again on two more days to be sure it wasn’t a fluke.
Cache hit rate on warm (2nd+) repeats of a byte-identical prefix, one panel per model. Each Gemini panel is the Google API; the shaded band is the 3–9K "dead zone" where agent prompts live. n=4 reps/cell, replicated across three days. Gemini metered through our own gateway ledger; OpenAI/Anthropic measured directly against their APIs.
Read the top row left to right and you get a generational story. Gemini 2.5 Flash caches patchily but works. Gemini 3.5 Flash caches at the edges and dies in the middle. Gemini 3.6 Flash — the newest — caches nothing until about 10K tokens, held across all 36 sub-9K cells on three separate days, with erratic hits above that. The bottom row is the control: GPT-4o-mini and Claude Haiku cache straight through the zone. The problem isn’t implicit caching, and it isn’t Gemini in general — it’s the newest Gemini, through Google’s own API.
Here’s why that number is the whole story: an agent’s prompt lives at 3K–9K tokens. System prompt, a handful of tool definitions, a few turns of history — that’s the entire working range of a lightweight agent loop, and it sits entirely inside the dead zone. A coding agent that drops a 40K-token file into context sails past the floor and caches fine. A scout, a tool-loop, a research agent re-reading the same instructions every turn — those never reach it, and pay full input price forever.
Here’s one of those runs in our own ledger — the same probe, four byte-identical turns at a ~6K-token prompt:
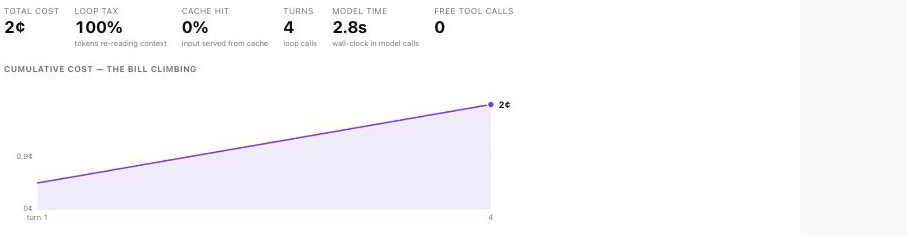
Our gateway's own cost X-ray for a single probe run: gemini-3.6-flash, a ~6K-token prompt sent four byte-identical times. Cache hit: 0% — every input token billed at the full $1.50/M, nothing served from cache, and the bill climbing turn over turn on a prompt that should have been almost free after the first send.
Why would Google do this? (it’s not a bug — it’s a page)
The interesting part isn’t that the dead zone exists. It’s why, and the cache told us that too.
Every nonzero cache read we measured on 3.6 Flash was a multiple of the same number:
8,156 · 8,166 · 8,168 → 16,312 · 16,344 · 16,360 → 24,480 … → 32,704 → 49,041
— that's 1×, 2×, 3×, 4×, 6× of ~8,160 tokens.
Caching isn’t happening token by token. It happens in ~8,160-token pages. Fast LLM serving stores the reusable attention state in fixed-size blocks — “paged attention,” the idea that made high-throughput inference practical — and you can only cache a whole page. So there’s a floor: you get nothing until you’ve filled the first page. The dead zone isn’t a switch someone flipped. The dead zone is the size of one page.
Which raises the real question a smart reader should sit with: why is the page ~8K on the newest model? Here’s the hypothesis the data points to, offered as a hypothesis: the page grew because the context window did. Gemini 3.x Flash ships a million-token context. A million-token cache split into small pages is an unmanageable number of blocks to index and evict; the natural fix is bigger pages. If that’s right, the agent-hostile cache floor is a side effect of the race to million-token context windows — nobody set out to tax small prompts, they optimized for long ones and the floor fell out the bottom. It’s a tuning tradeoff, not a conspiracy — and Google’s own support, when a developer reported this months ago, called it “internal regime changes,” which is exactly what per-size block management looks like from the outside.
The twist: it depends on where you buy the model
Run the exact same model — gemini-3.6-flash — through Vertex AI instead of the Google API, and the dead zone changes shape entirely:
The same weights, two serving stacks. Vertex caches at 4K and 9K, where the Google API caches nothing. Two completely different caching economics for a model with the same name.
So the honest headline isn’t “this model doesn’t cache.” It’s: whether your cache discount exists at all depends on which door you walk through to reach the model — and there is no way to know which door you’re getting except to meter what actually comes back.
What it costs
Cached input on 3.6 Flash is $0.15 per million tokens; uncached is $1.50 — a 10× difference on every token in the dead zone. For a single call that’s a rounding error. For a loop, it compounds:
Excess input spend versus a world where the dead-zone tokens cached at the advertised 90% off. Assumes ~170K dead-zone input tokens per run (a ~20-turn loop with prompts growing 2K→15K). The counterfactual is the advertised discount; measured hit rates above the floor are patchy, so treat these as the "vs. advertised" ceiling.
The tax scales with exactly the workload the model is marketed for. And because the discount is advertised as automatic, nobody sees the bill they aren’t getting — there’s no error, no warning, just a number quietly 10× higher than it should be.
It was knowable — and almost nobody knew
None of this was secret. A developer filed the dead zone on Google’s own issue tracker back in February. Google reproduced it, labeled it, and explained it as expected “regime changes.” The thread has sat there for five months. In that time the docs still promise automatic caching, -latest aliases still route agents straight into the floor, and the community pricing tables the whole ecosystem relies on still assume the discount applies.
The information existed. What was missing was the instrument that makes it actionable — something sitting in the request path, reading the provider’s own numbers, that turns “the docs say 90% off” into “your last 216 calls got 0% off, here’s the exact page boundary.” That’s the entire point of metering the path instead of trusting the price sheet.
You can’t see this — which is the actual problem
Everything above came out of a single afternoon, and it was only possible because we could read the provider’s own numbers as they came back. Most stacks can’t. Your cache-hit rate on the last thousand agent calls; the price you’re actually paying versus the one you were quoted; which model quietly stopped honoring a discount last week — those numbers ride on every response, and almost nothing surfaces them to you. That’s the real reason a five-month-old, reproduced, documented issue is still taxing production agents today: not that it’s hard to find, but that nobody is looking at the one place it shows up.
You can check this exact finding in about a minute — send the same prompt through the proxy twice and read whether the second one cached:
# $ACP_KEY authorizes; $GEMINI_KEY routes to the provider and gets metered
curl https://api.agenticcontrolplane.com/v1/chat/completions \
  -H "Authorization: Bearer $ACP_KEY" \
  -H "x-gemini-api-key: $GEMINI_KEY" \
  -d '{"model":"gemini-3.6-flash", ...}'
But the point was never this one call. Your agents are making thousands of calls right now whose real cost you can’t see — and a dead zone is only the surprise you already know to look for. A control plane is just the thing that sits in that path and answers what did that actually cost, and why — for every call, every model, all the time. We found this because ours was watching.