Hermes Agent Cost Tracking — the Local X-Ray From acp-hermes report

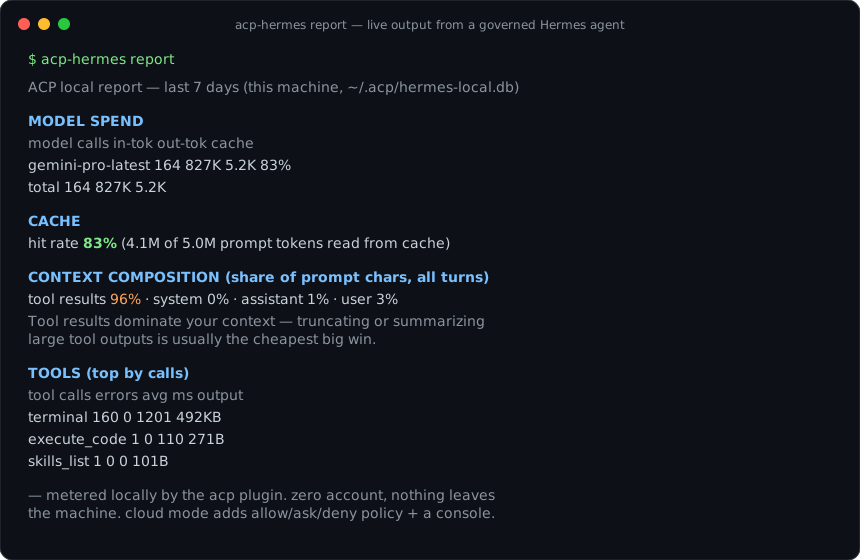
Just want the answer? Hermes already prices your calls internally. This plugin keeps the record and gives you a command to read it:
pip install acp-hermes && hermes plugins enable acp
# next session, then:
acp-hermes report
Full Hermes install guide → · get a workspace key → · local metering needs no account at all
Hermes Agent isn’t blind to cost the way some harnesses are — its own pricing engine already knows what a call costs and shows you the number. What it doesn’t give you natively is a record: a running total across sessions, a cache hit rate over the last week, a breakdown of which tool’s output is actually filling your context. acp-hermes adds that by hooking the same request Hermes already prices and writing it somewhere you can query.
This is the reference for what the plugin captures, how acp-hermes report reads back, and where the local plane’s honesty limits sit.
Where the numbers come from
The plugin registers four Hermes hooks, and two of them are the cost story:
| Hook | Plane | What it records |
|---|---|---|
post_api_request |
local | Each LLM API request — model, token buckets (input, output, cache read, cache write, reasoning), latency — priced with Hermes’s own pricing engine |
post_llm_call |
local | Context composition by role (system, user, assistant, tool results) per turn |
Both fire in-process, inside the Hermes runtime that’s already making the call. That’s a different mechanism from the proxy-based cost tracking documented for Claude Code and Codex CLI, which meter by sitting in front of the model API and reading the response’s usage fields as they pass through. Hermes’s plugin system gives a hook a synchronous view of the request Hermes itself just made — no base-URL swap, no traffic redirected anywhere. The two pre_tool_call / post_tool_call hooks handle tool-call policy and audit separately; they’re not part of the cost path.
Rows land in ~/.acp/hermes-local.db, a local SQLite database opened in WAL mode. Nothing from this plane is uploaded — the metering is a local file you own, not a network call.
Reading it back
After a session, acp-hermes report renders the last 7 days by default:
ACP local report — last 7 days (this machine, ~/.acp/hermes-local.db)

MODEL SPEND
  model                    calls   in-tok  out-tok  cache
  gemini-pro-latest          164     827K     5.2K    83%

CACHE  hit rate 83% (4.1M of 5.0M prompt tokens read from cache)

CONTEXT COMPOSITION (share of prompt chars, all turns)
  tool results 96% · system 0% · assistant 1% · user 3%
  Tool results dominate your context — truncating or summarizing large
  tool outputs is usually the cheapest big win.

TOOLS (top by calls)
  tool             calls  errors  avg ms   output
  terminal           160       0    1201    492KB
Four sections, each answering a different question:
- Model spend — calls, input and output tokens, and cache share per model. This is the closest thing to a bill: multiply Hermes’s own per-token rates by these counts and you get what the session cost, without opening a separate dashboard.
- Cache — the aggregate hit rate across all metered turns. A number this high (83% in the example above) means most of what the model reads on each turn is billed at the cache rate rather than full price; a number that drops session over session is worth investigating before it shows up as a bigger total.
- Context composition — where the prompt’s characters actually come from, not just its tokens. When tool results dominate, as they usually do in a coding or research agent, the cheapest lever isn’t a smaller model — it’s truncating or summarizing what a tool hands back before it re-enters context on the next turn.
- Tools — call counts, error rates, average latency, and output size per tool, which is the other half of “what’s expensive”: a tool with a high average output size is a candidate for the same truncation fix the context-composition line just pointed at.
--days 30 widens the window; --json returns the same figures as structured data instead of a rendered table, meant to be fed back to the agent so it can see its own economics and adjust rather than a person reading it in a terminal.
Unpriced routes stay unpriced
Hermes’s pricing engine covers the routes it knows, including OpenRouter and Bedrock. A call through a route the engine can’t price doesn’t get a guessed number — it’s reported unpriced, and the report’s troubleshooting note is explicit that token counts stay exact even when the dollar figure can’t be computed. That matters more for a local X-ray than it would for a dashboard you can cross-check elsewhere: this report is often the only place the number exists, so a silently wrong price would be worse than an honest gap.
Turning it off, or moving it
Two environment variables cover the knobs:
export ACP_LOCAL_METERING=off      # disable local metering entirely
export ACP_LOCAL_DB=/path/to.db    # move the DB (default ~/.acp/hermes-local.db)
If acp-hermes report comes back with no metered activity, the usual cause is the plugin not actually being enabled for the current session — hermes plugins list should show it, and a session started before you ran hermes plugins enable acp won’t have the hook wired in retroactively.
What the cloud plane adds — and doesn’t
acp-hermes login is a separate, optional step that wires up server-side policy (allow / ask / deny on tool calls), a cross-machine activity log, and a team dashboard. It doesn’t change how cost is computed or where it lives — the SQLite database and acp-hermes report work identically with or without login, because pricing happens locally against Hermes’s own engine regardless of which plane is active. If you’re deciding whether to add it, decide on the policy and audit story, not the cost one.
Budget limits
There isn’t a native cap here. acp-hermes gives you the number after the fact — a report you can read, not a threshold that stops a call. If a hard budget limit matters more than visibility for a given deployment, that’s a workspace-level control on the cloud plane’s policy surface, not something the local report enforces on its own.
Frequently asked questions
Does Hermes Agent track cost?
Hermes prices calls with its own pricing engine and shows you the numbers already. What it doesn’t do natively is keep a persistent, queryable record across sessions — a running total, a breakdown by model or tool, a cache hit rate over the last week. The acp-hermes plugin adds that record by hooking the same request Hermes already prices, writing it to a local database, and giving you a report command over it.
How does the plugin see cost without routing calls through a proxy?
It doesn’t need to. The plugin registers Hermes’s post_api_request hook, which fires in-process on every LLM API request and hands the hook the model, the token buckets (input, output, cache read, cache write, reasoning), and the latency. The plugin prices that with Hermes’s own pricing engine — the same numbers Hermes shows you — and writes a row to SQLite. No model traffic leaves the process differently than it already did; this is Hermes’s local metering plane, not the proxy-based cost X-ray other harnesses use.
What's the difference between acp-hermes report and report --json?
Same underlying data, different consumer. report renders the human-readable tables — model spend, cache hit rate, context composition, top tools. report –json emits the same figures as structured data, meant to be fed back to the agent itself so it can see its own economics and self-optimize, rather than a person reading a table.
What happens when the plugin can't price a call?
It says so. Hermes’s pricing engine covers its usual routes plus OpenRouter and Bedrock, but an unusual self-hosted or proxied endpoint can fall outside what it knows how to price. Those calls show as unpriced rather than an invented number — token counts stay exact even when the dollar figure can’t be computed.
Where to read more
- Claude Code cost tracking reference — the proxy-based cost X-ray, for comparison with Hermes’s in-process hook
- Codex CLI cost tracking — the sibling reference for Codex
- Hermes Agent install guide — the full plugin setup, including the policy and audit plane
- Setting up an autonomous Hermes agent safely — the policy side of the same plugin, for unattended runs